In Logpoint, reports can be created in 3 different ways.
From a Search Query.
From Dashboards.
From a Report Template
Go to Search.
Enter a Search Query.
Click the More drop-down menu.
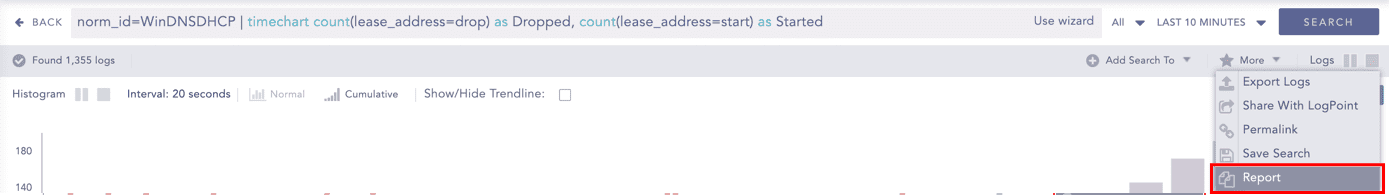
Creating a Report
Select Report to open the Create Report panel.
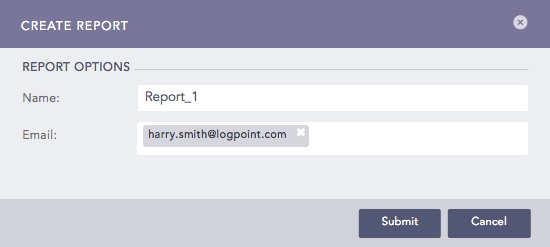
Creating a Report
Provide a Name and an E-mail Address.
Click Submit.
Go to Dashboard from the navigation bar and click Report.

Creating a Report
Enter a Name and an E-mail Address.
Creating a Report
Click Submit.
By using a Report Template, you can specify the format and the design of the report. However, to generate a report using this method, you need to first define parameters such as panels and headers of the template itself.
To successfully generate a report, you need to first provide a correct and valid query. You can either create a new query on your own or choose one from the history.
Go to Reports from the navigation bar.
Click Report Templates under the Reporting menu on the left.
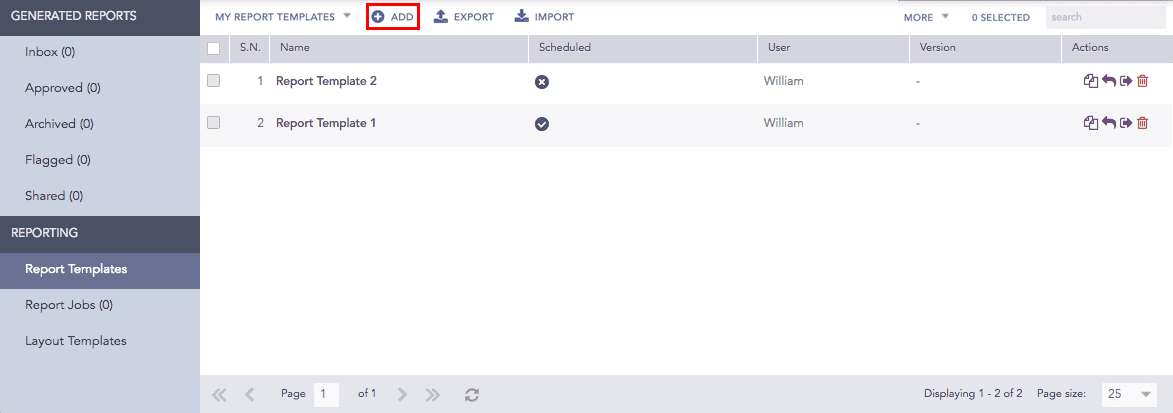
Click Add.
Enter a name for the Report Template by clicking the write icon.
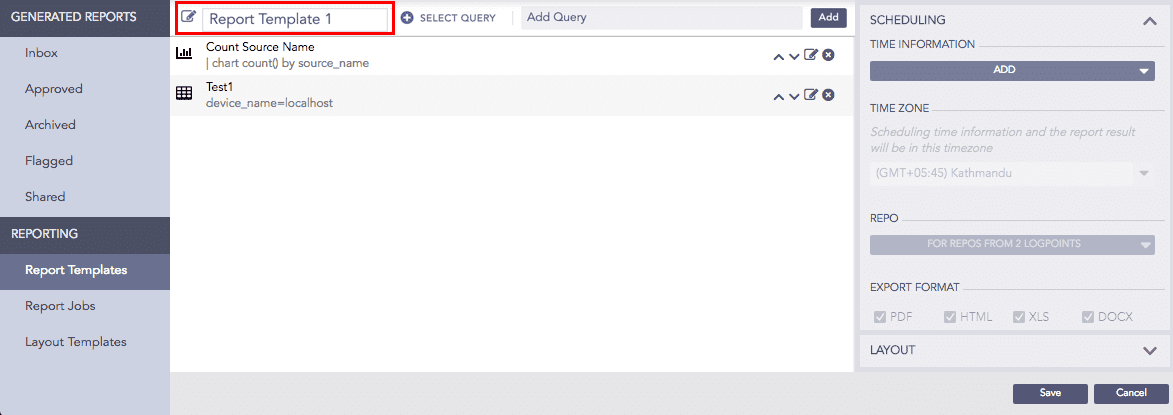
Enter a valid query in the Add Query tab or click Select Query to open the Advanced Query Picker. If you select the Advanced Query Picker, choose queries from the provided lists.
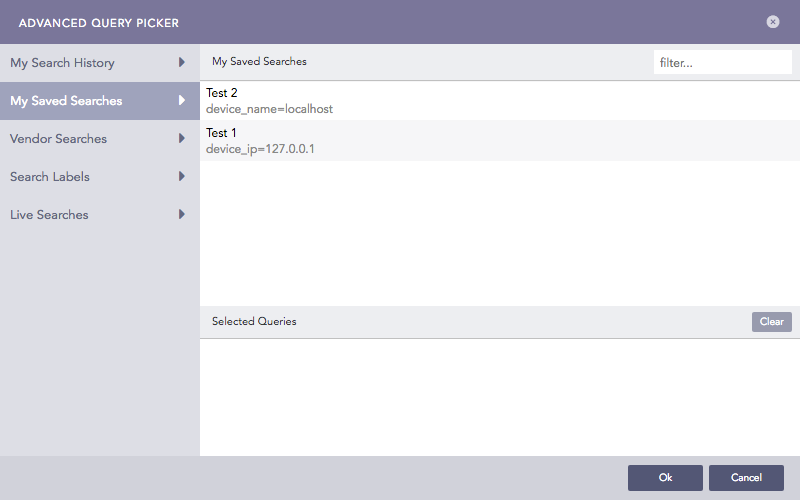
Advance Query Picker
Note
While selecting a Live Search from the Advance Query Picker, the title of the live search, created from the Dashboard, is automatically entered in the panel header field.
If you are using a timechart query with grouping parameters and it has more than ten values, the report is generated with an error message. This is done so as not to affect the rendering properties of the graph in the report.
Click Add to open the Rendering Options panel.
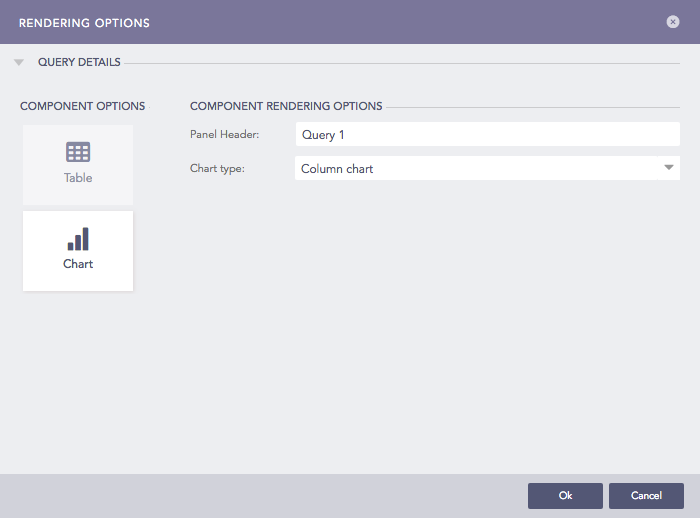
Rendering Options Panel
Provide a header on the Panel Header textbox.
Choose a Limit for the number of logs.
Note
Limit is visible only for non-aggregate commands.
Choose one of the Component Options.
Note
If you choose the Chart component option, choose the Chart type from the drop-down menu.
Click Ok.
Using this option, you can schedule the generation of reports.
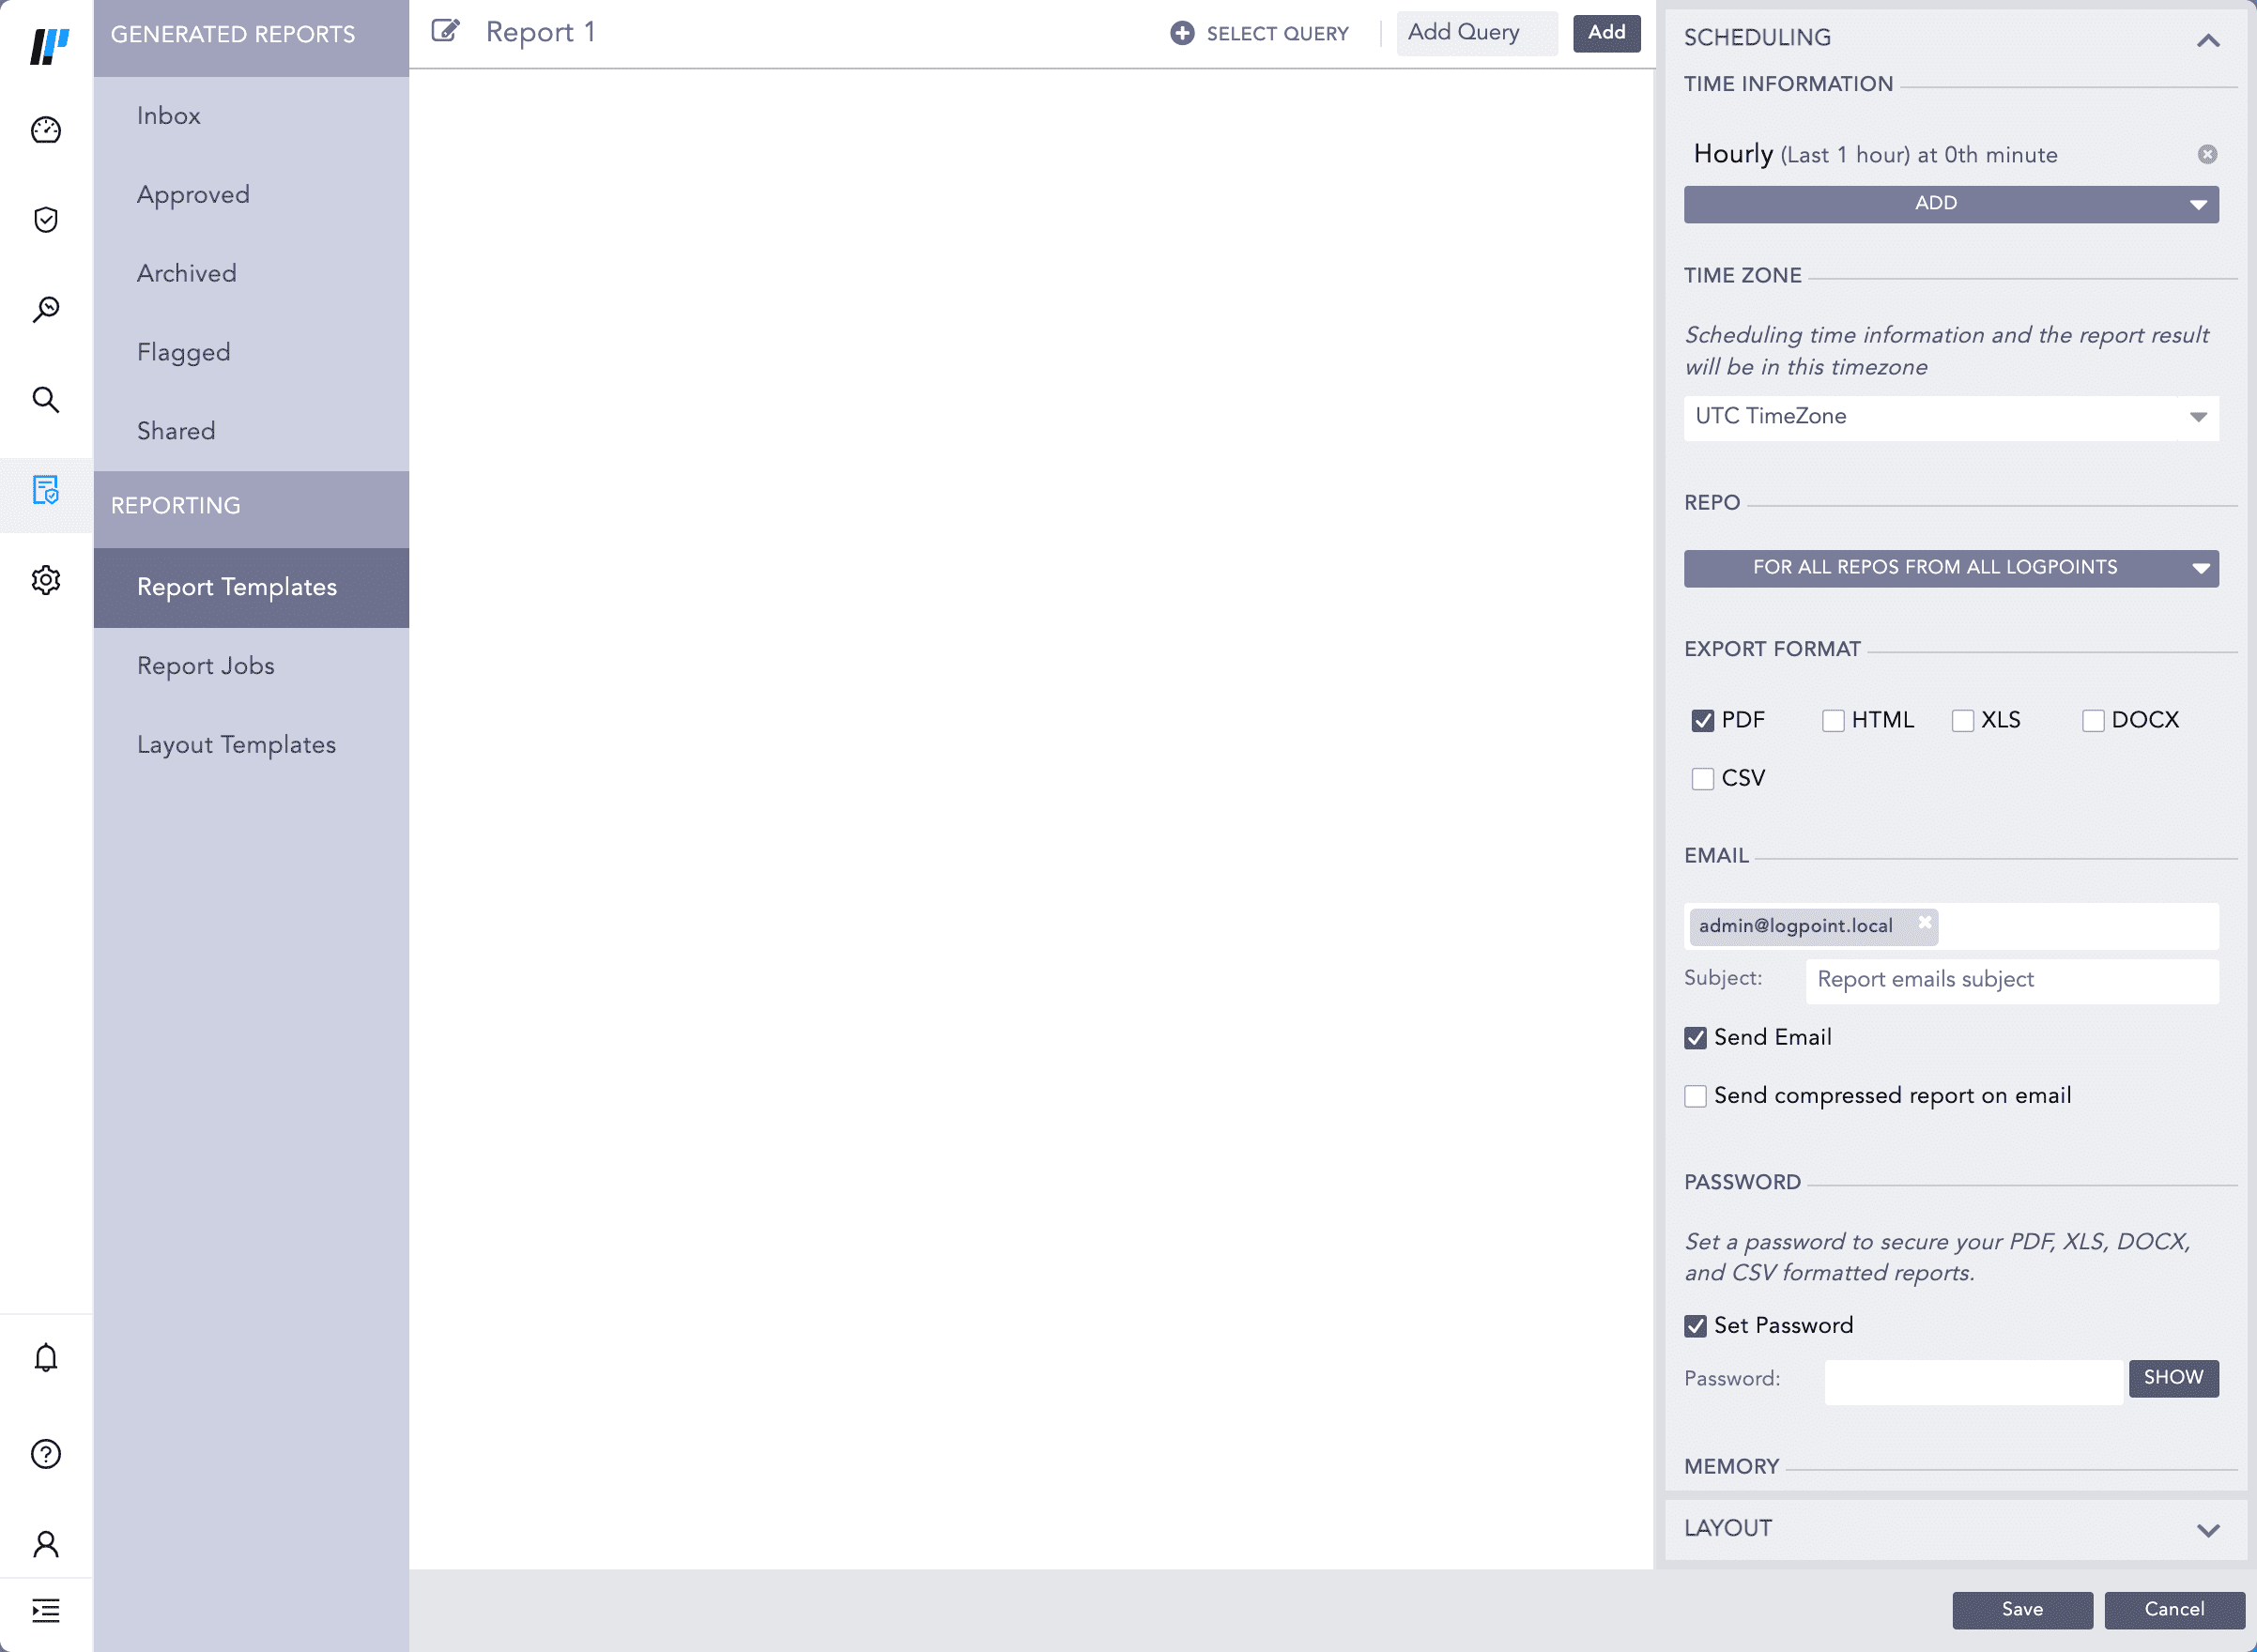
Scheduling Reports
In the Scheduling panel on the right, click Add.
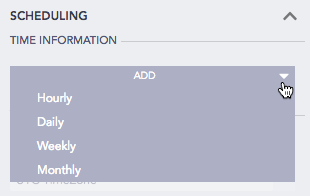
Add under Time Information Section
Choose the options in the drop-down menu to schedule the report generation to the minute. If you choose the Monthly tab, Logpoint creates a link titled Monthly (Last 30 days) on 1st day, 0th hour. Click the link to open the Monthly Scheduling panel.
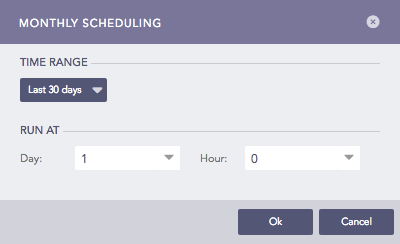
Defining Time Range
Select a Time Range.
Select a Day and an Hour to generate the report generation process.
Select a Time Zone. The scheduling time information and the report results are generated in the selected timezone.
Select Repos.
Select the formats in which you want to generate the report.
Select the Send email and enter the e-mail address(es) and Subject to send the report as an e-mail.
Select the Send compressed report on email to get a compressed report on your email.
Note
If you choose the HTML format, the report is zipped regardless of the option you choose.
If you want to encrypt your report, select Set Password and enter a password.
Note
Reports in formats PDF, XLS, DOCX, and CSV are password protected.
Password length can be between 5-255 characters.
If Data Privacy Module is enabled in the system, the Data privacy module tab is visible.
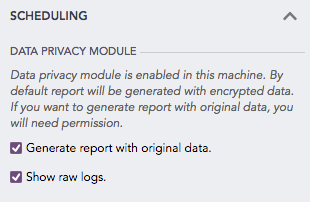
Select the Generate report with original data to generate decrypted values in the report.
Select the Show raw logs to get access to the raw logs in the generated report.
Note
When Data Privacy Module is enabled, if you select Generate report with the original data, a request message is sent to the users with the Can Grant Access permission. To view requests, go to
Settings >> Configurations >> Data Privacy Module >> Pending Request.The scheduled reports are generated only if the request is approved.
Click Layout below the Scheduling tab.
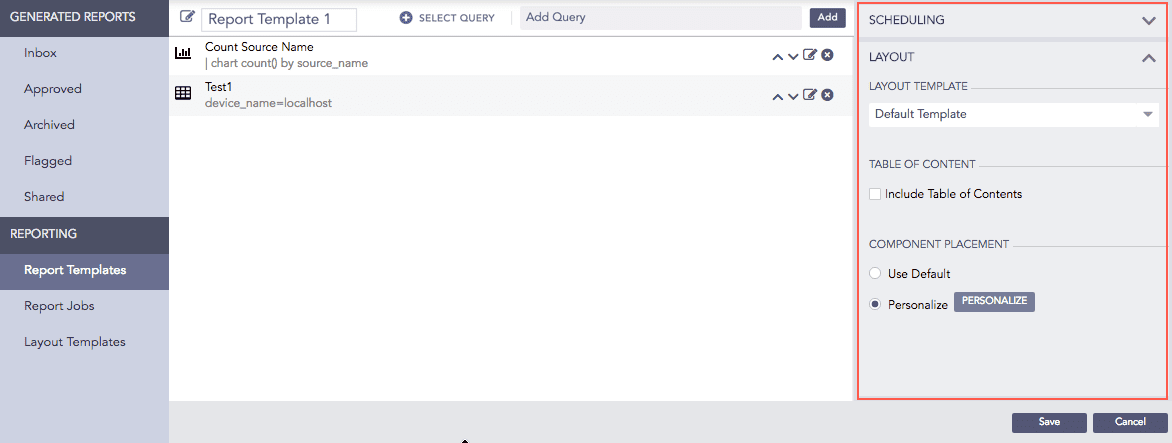
Layout
Choose a Layout Template.
Enable the Include Table of Contents checkbox to add a table of contents in the report.
Select a Component Placement.
If you choose Use Default, Logpoint positions the components in the report automatically.
If you choose Personalize, you can choose the placement of the components in the report.
Choosing Personalize opens the Report Design panel.
The placement of the components depends on how you configure the panels and headers in the Report Design panel.
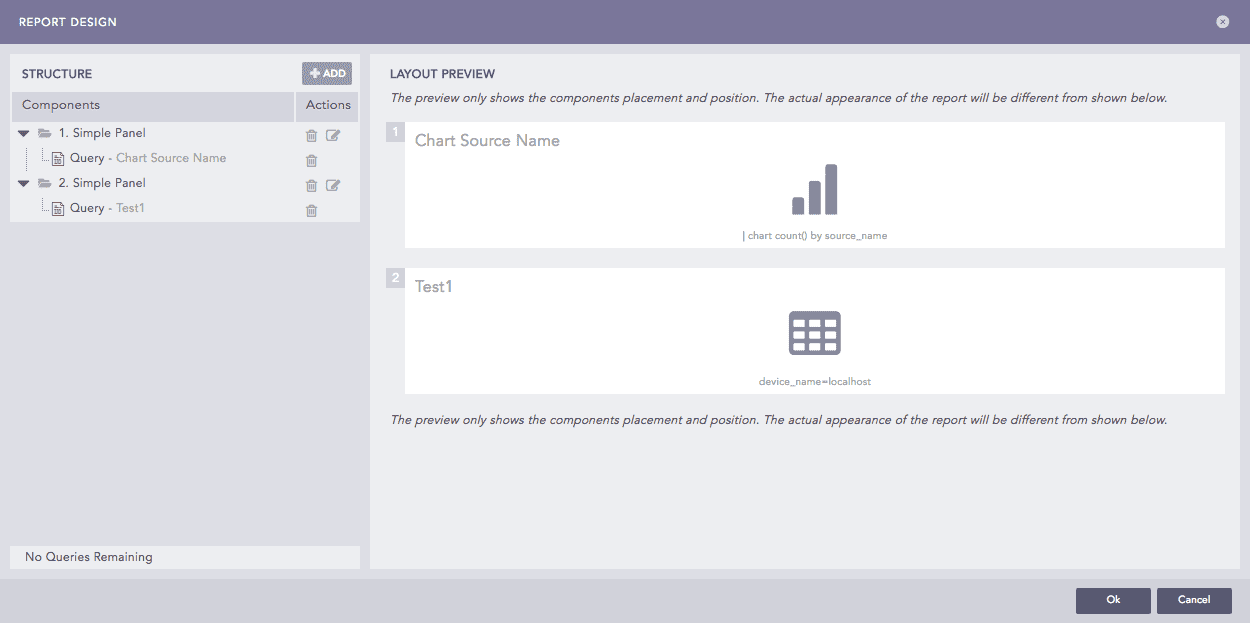
Report Design Panel
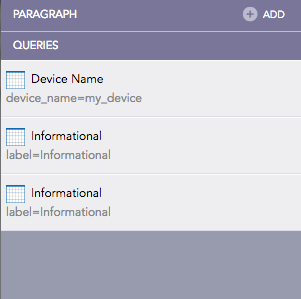
The panel is divided into two sections, Structure and Layout Preview. All the queries created earlier are listed under the structure section and the layout of your report can be previewed in the layout preview.
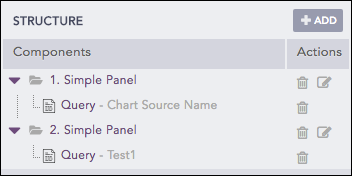
Structure
In the Structure section, click Add.
Choose the component that you want to add to the template.
If you choose a Panel, enter the Position, Area 1 width, and Count.
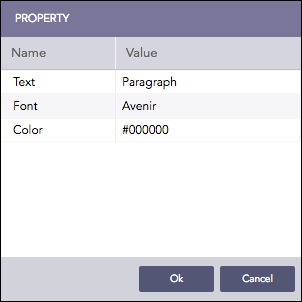
If you choose a Header, enter the Position, Text, Font, and Color.
Note
Area 1 width does not appear for Simple Panel.
You can also add a Page Break to the template. In this case, provide a Position.
The added components appear in the Components section.
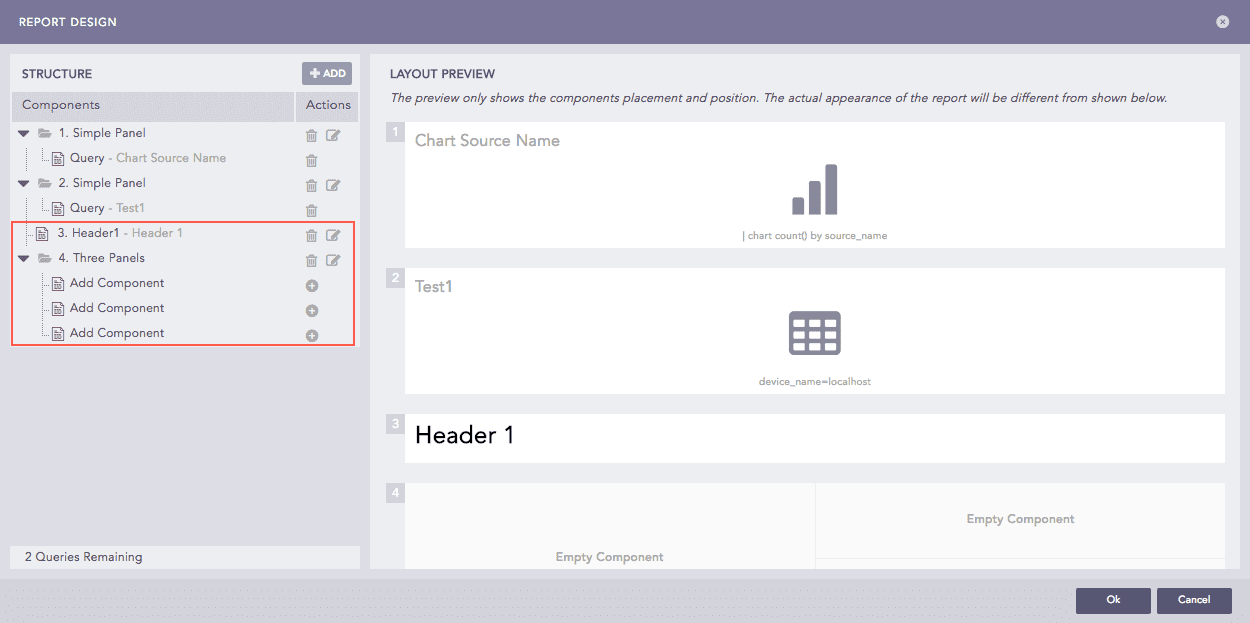
Report Design
To add components in a panel, click the  button for the respective panel. You can either add the results of a query or a paragraph.
You can add as many Panels, Headers, and Paragraphs that you want. However, you can add a single query only once.
Edit or Delete the components by clicking the respective buttons.
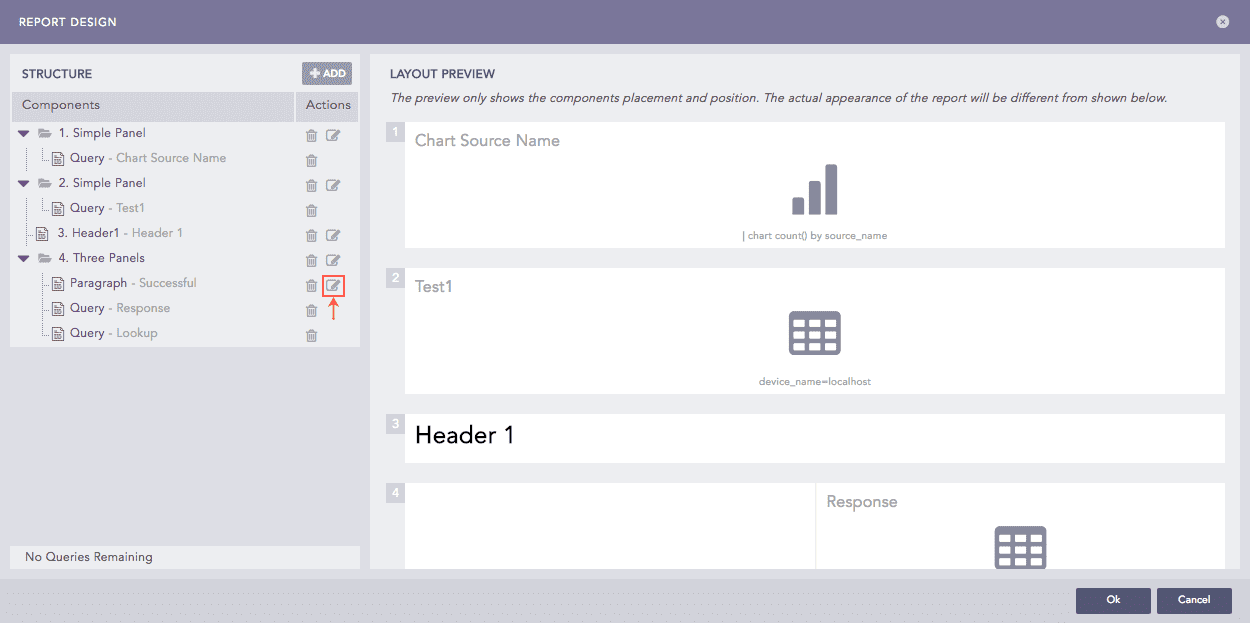
The Edit Button for Components
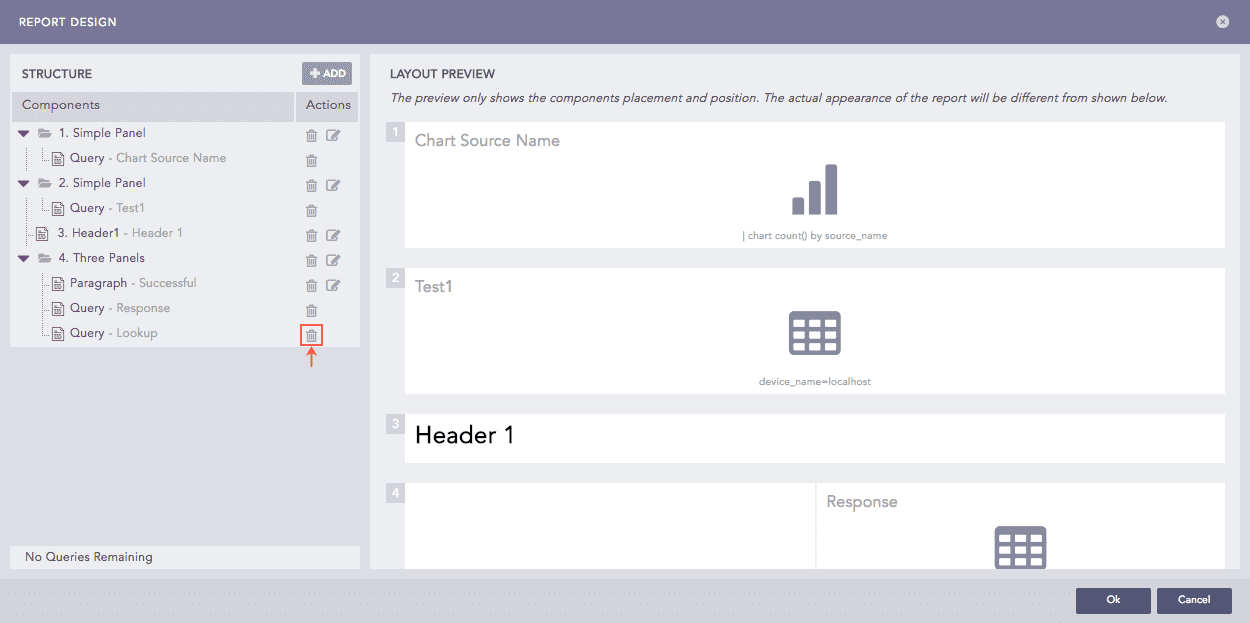
The Delete Button for Components
Click Ok.